
|
|
|
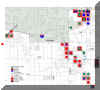
| DELHI TOWNSHIP DOWNTOWN DEVELOPMENT
AUTHORITY Delhi Township enjoyed explosive growth during the 1990s but had no way to communicate the results of their work to the general public. Using assessing records, a base map of all retail, office and industrial space was created. This data was then summarized in a way that allows one to see exactly where the growth occurred. Other maps in the series show only industry, only retail, and only office. Added benefits include the ability to select businesses by proximity to certain roads, businesses close to other businesses and a wide range of other analyses that will help the Township sharpen its focus. A second element of this project was the database that fuels the map. This database is now the foundation for the Township's business retention program and streamlines communications, |
|
 Click to enlarge |
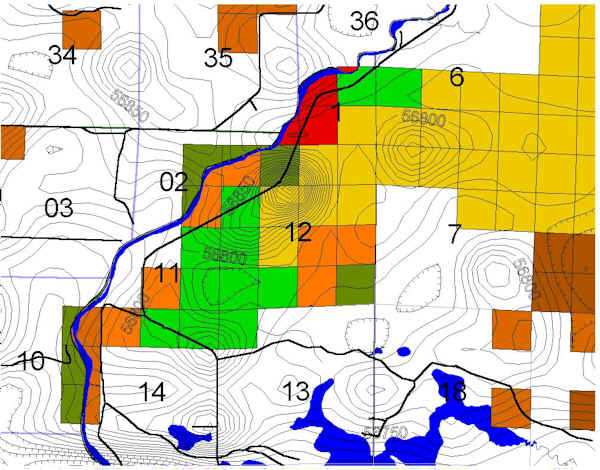
MENOMINEE RIVER EXPLORATION COMPANY Using diverse sources of both geographic and company information, an ArcView-based GIS system was created to manage property ownership status, natural features, and geologic data stored in CAD and Surfer files. This tool has been invaluable to the company as it interacts with investors, the public, and for its own internal management. |
 Click to enlarge |
SMALL TOWN RETAILER A small retailer had declining sales for the first time in its 20 year history. Geographic Insights used the store's customer base, analyzed the commuting patterns of the community, calculated market areas of its major competitors and overlaid the results of each analysis to determine the best course of action. This sample map compared drive times from the store with the drive times of a cluster of competitors. A fundamental re-thinking of the store's marketing and approach to customer service was the result of this analysis. Click on the map for more details on the analysis. |
 Click to enlarge |
POLITICAL DISTRICTING In this case, the Battle Creek Area Chamber of Commerce needed to know into which state house districts their members belong. This map illustrates the power of combining districting data with client data to derive something that would be very time-consuming and error-prone to do otherwise. This work is one of the foundations of a SmartMap that will soon be implemented. |
 Click to enlarge |
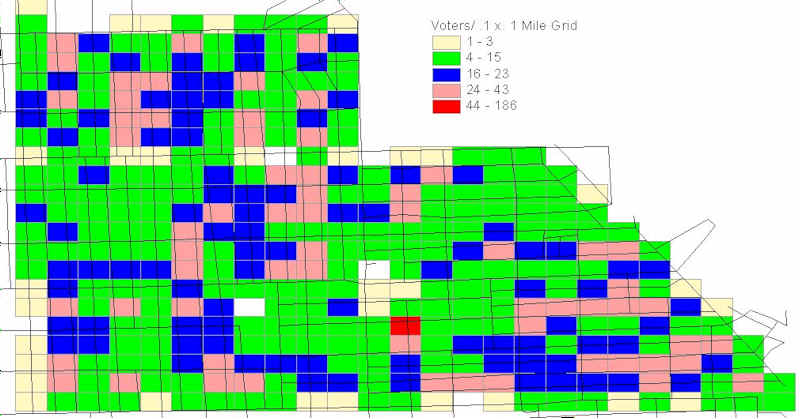
VOTER TARGETING Use Geographic Insights' methodology and techniques to pin-point a political campaign. It is effective in targeting neighborhoods for walking campaigns, billboard placements, yard signs, and in more tightly focusing the efforts of a candidate/issue. |